![Green Bottles, Alan's Ark & COVID Odyssey: Alan Grace's vir[tu]al journey](https://aaamazingphoenix.files.wordpress.com/2020/05/animation_500_kcijq1n6.gif)
Updates for New Zealand Delta variant data and results see below.
For earlier and other variants see:
COVID Odyssey: Winter Warning NZ 6 ~ Estimating the number of 2021 Cases ~ A simpler formula
COVID Odyssey: Winter Warning NZ 2 ~ Delta variant ~ Lockdown 4 appears to be working
For COVID-19 we have estimated Ro to be in the range 6 to 7.8 based on daily case numbers worldwide up to 6 August 2020.
Below, we extend the range for Ro to be from 5 to 8 after reviewing worldwide case numbers on 6 August 2021.
This is the same range (Ro = 5 to 8) that experts have estimated for the Delta variant.
The Delta variant is estimated to be at least twice as infectious as the early 2020 variant. Also see:
COVID Odyssey: Winter Windup 5 ~ Conclusions for NZ in 2020 ~ Back to the past: Re = 5.8 and Ro = 6
COVID-19: NZ should have gone to Level 4 (lockdown) earlier. Worldwide 420,718 cases; 18,800 deaths.
For the Delta variant we have estimated Ro to be in the range 9 to 12.7.
Ro is the number of people on average one person may infect without quarantine or isolation.
Our estimates for the daily increase, r, for each country are calculated using cases up to 6 August 2020.
Using simulations, we have developed a formula and a methodology to estimate Ro from high values for r using daily case numbers.
We estimate a range for Ro based on our analysis of case numbers for over 175 countries/territories.
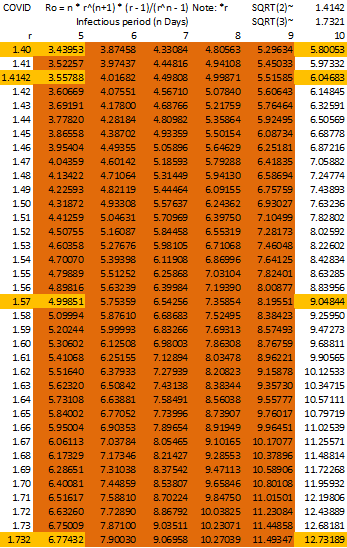
In the original 2020 outbreak, assuming with an infectious period of n = 10 days, we have (using our formula for Ro below):
- For Turkey, r = 1.52, and Ro = 8
- For China and the USA, r = 1.5 and Ro = 7.8 based on r = 1.51
- For New Zealand, r = 1.4, Re = 5.8, and Ro = 6 when r = SQRT(2)
- For the UK, r = 1.3575, and Ro = 5
The above give us our range for Ro.
For r = SQRT(2), Ro = 6.0 (1 dp) using the formula, we may have case numbers doubling every two days.
For r = SQRT(3), Ro = 12.7 (1 dp), we may have case numbers tripling every two days (for the Delta variant).
The figures for the 31 countries below (with over 1,000,000 cases on 6 August 2021) were retrieved on 6 August 2021 from
https://www.worldometers.info/coronavirus/#countries
Update: China is not included because by 6 August 2021 China claimed to have less than 100,000 cases and even by the end of 2022 China acknowledged having less than 500,000 cases. See:
https://www.worldometers.info/coronavirus/country/china/
Highest 31 Countries by case numbers
Highest 31 countries ranked by r
Daily values for r for each country were estimated using Excel once case numbers were at least 30. For our methodology for estimating r, see:
By definition we let:
- r denote the effective Reproduction rate of COVID-19 for one day
- Ro (R0; R-Zero; R-Nought) denote the Reproduction number for COVID-19 without any quarantine or isolation
- Re denote the effective Reproduction number for COVID-19
(Re assumes isolation/quarantine is happening) - a case be defined as a person diagnosed as having COVID-19
Note that Ro and Re are numbers (not rates), the number of people one person with COVID-19 may infect on average without quarantine or isolation (Ro) and with quarantine or isolation (Re).
We considered widening our range estimate for COVID-19 in early 2020 after looking at world case numbers up to 6 August 2021. See:
COVID Odyssey: Winter Windup 12 ~ Conclusion~ Ro = 6 to 7.8 in early 2020?
We accept a range for Ro in early 2020 between 5 and 8 to include Turkey and the UK.
We note that the range 5 to 8 is the same as the estimate for the Delta variant in the image below:

See:
https://www.bbc.com/news/health-57431420
We calculate Ro from r using our formula:
We assume n = 10 days and that infectivity decreases daily at a rate of 1/r.
We would need a range for Ro from 4 to 8 to hopefully include all 31 countries in the lists below except India, Iran, and Iraq. We consider this range may be too wide to be acceptable.
Australia would also still be excluded.
The results are considered together with the 31 countries with over 1,000,000 cases of COVID-19 on 6 August 2021.
The lists in the tables below contain all 31 countries with over 1,000,000 cases of COVID-19 on 6 August 2021.
Update: China is not included because by 6 August 2021 China claimed to have less than 100,000 cases and even by the end of 2022 China acknowledged having less than 500,000 cases. See:
https://www.worldometers.info/coronavirus/country/china/
COVID Odyssey: Worldwide Winter Windup 3 ~ COVID-19 in 2020 vs 2021 ~ Cases per million people


See also:
Highest 31 Countries by case numbers
Highest 31 countries ranked by r
In the tables above Re#2 is an estimate for Ro, calculated using our formula for Ro:
We assume n = 10 days and that infectivity decreases daily at a rate of 1/r.
We have used simulations in Excel to create the formula. See:
COVID Odyssey: Winter Windup 14 ~ COVID-19 ~ Simulations to develop our formula for Ro
We also consider:
COVID Odyssey: Winter Windup 13 ~ Is the COVID-19 Delta variant as infectious as measles?
Experts think the COVID-19 Delta variant is much more contagious than the flu and chickenpox, and on par with the measles. See:
https://www.healthline.com/health-news/cdc-says-delta-variant-as-infectious-as-chickenpox-what-to-know-now
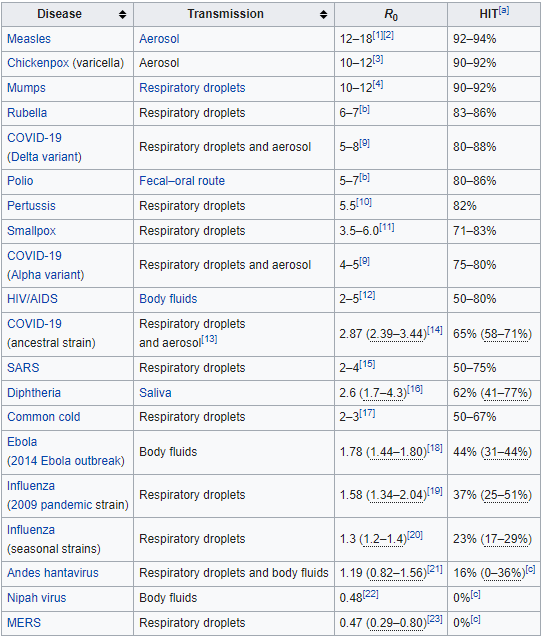
For these values of Ro and herd immunity thresholds (HITs) of well-known infectious diseases prior to intervention, see:
https://en.wikipedia.org/wiki/Basic_reproduction_number
Note that Ro and Re are numbers (not rates), the number of people one person with COVID-19 may infect on average without quarantine or isolation (Ro) and with quarantine or isolation (Re).
We have chosen n = 10 days. In the tables below, if n > 10 days, the values for Ro are likely to be too high to be acceptable.

We have also used this version:
Note:
- Ro = 8 corresponds to r = 1.52, near the r = 1.5 estimated for China, The USA, and South Korea.
- Ro = 6 corresponds to r = SQRT(2), near the r = 1.4 estimated for New Zealand, Italy, France, Norway, and Poland.
Reminder:
For r = SQRT(2), Ro = 6.0 (1 dp), we may have case numbers doubling every two days.
For r = SQRT(3), Ro = 12.7 (1 dp), we may have case numbers tripling every two days (for the Delta variant).
For the Delta variant, we have estimated Ro to be in the range 9.0 to 12.7 (1 dp).
For our methodology to estimate r for countries, see:
https://aaamazingphoenix.wordpress.com/?s=windup
https://www.healthline.com/health/r-nought-reproduction-number#covid-19-r-0
The above website mentions this article which estimates a median value for Ro of 5.7:
https://wwwnc.cdc.gov/eid/article/26/7/20-0282_article
We find that the range 5 to 8 for Ro is likely to be conservative because:
- the 5 and 8 are based on values for Re with no increase for estimating Ro
- The number of infectious days is only n = 10
- The infectious days start before cases are symptomatic
I believe that New Zealand has done the right thing moving to Lockdown Level 4 quickly this week when a case of the Delta variant was discovered in the community.
Let’s hope New Zealand does not need to stay in Lockdown Level 4 for a lengthy period.
Alan Grace
18 August 2021
PS For a list of all my posts (pingbacks) see:

10 Comments Add yours