![Green Bottles, Alan's Ark & COVID Odyssey: Alan Grace's vir[tu]al journey](https://aaamazingphoenix.files.wordpress.com/2020/05/animation_500_kcijq1n6.gif)
March Equinox
March passed milestone equinox
Spoiled soiled world embroiled on rocks
Dark nights groan longer
Virus grows stronger
Locks, stocks, and clocks feel the shocks
Akan Grace
30 May 2020
This post contains annotations for some of my COVID-19 posts.
The complete (numbered) index (Contents) can be found here:
https://aaamazingphoenix.wordpress.com/2020/05/28/my-covid-odyssey-by-alan-grace/
The posts with the highest numbers are the earliest.
Almost all of my most recent 100 posts relate to COVID-19.
About three do not. They have been kept on this list since they form part of my journey. All my posts (808) are still in this blog- use tags or the search menu to find them (or scroll down a long way!).
We find that one infected person may on average infect 5.3782 (more than 5 and 3/8 and possibly 6) other people in New Zealand in March (This is twice as many people as most expects expect). See:
https://aaamazingphoenix.wordpress.com/2020/05/27/covid-19-nz-is-re-5-3782/
We will start from #100 (see index) and go down towards #1
#100
The animation you can see on the Title page and many others is produced from this data:
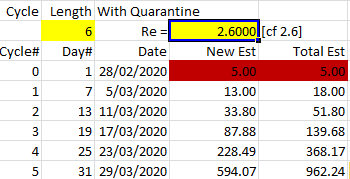
The totals are in the last column. The totals get big very quickly. See #15.
We use a similar table in #6 to estimate Re = 5.3782.
This is at least double what most experts expect.

#99
We expect the data to be exponential. Surprisingly a quadratic worked!
#98
We find an S-Shaped curve works.
It is easiest to just “flip” (rotate by 180 degrees) the curve up to the midpoint to estimate numbers beyond the midpoint.
#96
Video: What is the Coronavirus?
#91
Finding the midpoint is difficult especially when you are looking as each day’s cases occur.
#90
Estimating the death rate is also difficult.
#83
Even when the number of cases are low, cases can grow and new cases can continue for months.
#82
Disclosure: I have a background in maths not health.
#75
It worked well for NZ to Lockdown early.
#59
Even a worst case scenario can be way out. 27,600 deaths?
#47
Only the second death in New Zealand on 10 April.
Healthy virus-free day for us.
#34
Fibonacci sequences work better than expected.
#29
Immunity is in doubt after people recover.
#27
Midpoint revisited.
#26
Moving averages are useful.
#21
Apply Occam’s Razor.
#20
Midpoint again.
#12
Tracer App.
#9
Tracer App design/ implementation flawed.
#8
Fibonacci again.
#6
Please read Update:
COVID Odyssey Ro update: Occam’s Razor~ A close shave: NZ Ro~2.9; Ro = 4.8r-3.8
Original finding: Re and Ro twice as big as expected.
One infected person may on average infect 5.3782 (more than 5 and 3/8 and possibly up to 6) other people in New Zealand in March (even 5.3782 is twice as many people as most expects expect). See:
https://aaamazingphoenix.wordpress.com/2020/05/27/covid-19-nz-is-re-5-3782/
#4
COVID-19 demand for Courier services causes considerable delays.
#3
End of the Odyssey (for now).
#2
The page you are reading.
#1
New year bliss/ ignorance earlier this year. What a difference a month or two makes!
My other COVID-19 posts can be found here:
https://aaamazingphoenix.wordpress.com/tag/coronavirus/
Data for my posts can be found at:
https://www.worldometers.info/coronavirus/
https://en.wikipedia.org/wiki/2020_coronavirus_pandemic_in_New_Zealand
https://www.ecdc.europa.eu/en/publications-data/download-todays-data-geographic-distribution-covid-19-cases-worldwide
https://ourworldindata.org/coronavirus-source-data
https://www.webmd.com/lung/news/20200507/100-days-into-covid10-where-do-we-stand
https://projects.fivethirtyeight.com/covid-forecasts/?
https://ourworldindata.org/coronavirus-source-data
I share my posts at:
https://guestdailyposts.wordpress.com/guest-pingbacks/

5 Comments Add yours