![Green Bottles, Alan's Ark & COVID Odyssey: Alan Grace's vir[tu]al journey](https://aaamazingphoenix.wordpress.com/wp-content/uploads/2020/05/animation_500_kcijq1n6.gif)
Please read Update:
COVID Odyssey Ro update: Occam’s Razor~ A close shave: In NZ is Ro ~ 3, 4, or 6? What are Ro values worldwide?
We look at the spread of COVID-19 in the 12 worst-affected African countries and look at this article published 16 July 2020:
Africas40249-020-00718-y
The 12 African countries are (alphabetically):
Algeria
Cameroon
Egypt
Ghana
Kenya
Mali
Mauritania
Morocco
Nigeria
Senegal
South Africa
Sudan
We created our own graph using data from the website below:

We estimate Ro (see below) by applying the analysis undertaken in New Zealand to the rest of the world. Note that data for the analysis below is for confirmed cases (only) downloaded from the website:
https://ourworldindata.org/covid-cases
For background, see:
https://aaamazingphoenix.wordpress.com/2020/08/09/covid-odyssey-virtual-world-tour-how-many-people-can-one-person-infect-in-your-country/
The article estimates Ro and contains similar points plotted on the graph below:
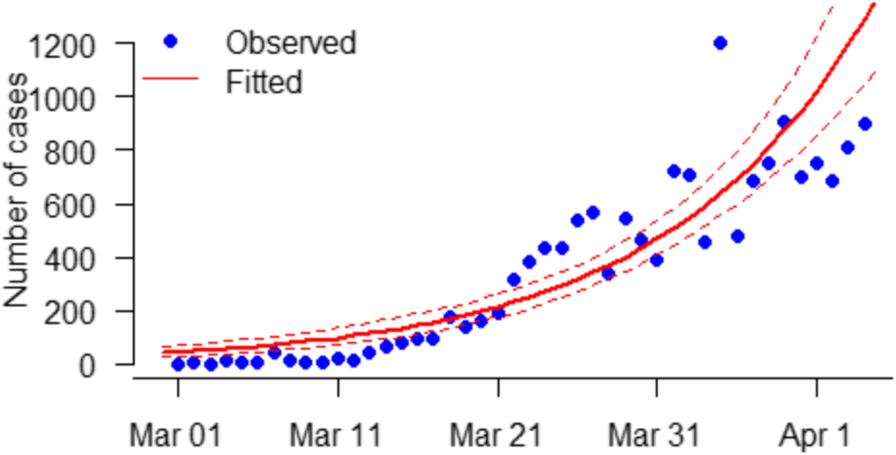
The observed (dots) and fitted (curves) daily number of COVID-19 cases time series in Africa. The blue dots are observations, and the curves are fitting results. The red bold curve represents the mean fitting result, and the red dashed curves are the 95% confidence intervals. Multiple R-squared is 0.76
The exponential growth fitting results are depicted in Fig. 1 (above). The fitting results matched the observed daily number of cases, which implies that the early outbreak data in Africa were largely following the exponential growth rate estimated at 0.22 per day (95% CI: 0.20–0.24), which is slightly larger than previous estimates [7, 9, 14]. Our analysis and estimation of R0 rely on the accuracy of the SI of COVID-19 estimated previously based on cases from Hong Kong, China [11]. We estimated the basic reproduction number R0 to be 2.37 (95% CI: 2.22–2.51).
The graphs have some similarities.
The article uses all the data shown on the graph to estimate Ro.
We suggest that it is best to estimate Ro from early data so that isolation and quarantine do not provide a low estimate for Ro.
We also use cumulative data to estimate Ro.
We assume a homogeneous population and an S-I-R model early in a COVID-19 outbreak where everyone is (equally) susceptible, daily case numbers indicate the number of infectious people, and no people have recovered.
For background information see:
COVID Odyssey. COVID-19 NZ: Re#2~5.8 (see below) & Ro~6
https://aaamazingphoenix.wordpress.com/2020/05/27/covid-19-nz-is-re-5-3782/
(data in the above link includes confirmed and probable cases).
Hence results below using only confirmed cases are likely to be less than those in the link above.
We have looked at the following simulation several times showing the outspread of COVID-19 (Coronavirus) from 5 to over 360 people in 5 cycles with Re = 2.6:

Source: New York Times.
How can a Coronavirus out-spread from 5 to 368 people in 5 Cycles (Credit: The New York Times)?
If 5 people with new coronavirus can impact 2.6 others each, then 5 people could be sick after 1 Cycle, 18 people after 2 Cycles, 52 people after 3 Cycles and so on. See:
https://towardsdatascience.com/how-bad-will-the-coronavirus-outbreak-get-predicting-the-outbreak-figures-f0b8e8b61991
We assume a cycle length of 5 days.
For any day D, let:
- C[D] denote the number of cases on day D.
- Re denote the effective Reproduction number of COVID-19 for one cycle.
- Re#2 denote the effective Reproduction number of COVID-19 for two cycles.
- r denote the effective Reproduction rate of COVID-19 for one day.
- Ro denote the Reproduction number without any quarantine or isolation.
i.e. the average number of people one person with COVID-19 on average may infect when there is no quarantine or isolation.
Re and Re#2 estimate the average number of people infected by one person with COVID-19.
We want to use high values for Re, r and Re#2 to estimate Ro.
We assume Ro is a constant for COVID-19 for a country. We assume that we can use Ro values for countries to estimate a range of values for Ro world-wide.
For COVID-19 in NZ we found that Re#2~5.8 & Ro~6. See:
https://aaamazingphoenix.wordpress.com/2020/05/27/covid-19-nz-is-re-5-3782/
We could calculate r by using the formula r = C[D+1]/C[D], however this could create quite large fluctuations from day to day.
Instead for each day D, we first calculate
Re = C[D+5] / C[D]
then calculate
r = Re ^ (1/5)
where ^ means ‘to the power of’.
We can also estimate r from C[D], starting with a given day D, and C[D+d], the number of cases d days later, using the formula
r = ( C[D+d] / C[D] ) ^ (1/d)
We have used this formula above for d=5.
We can now calculate Re#2 using the formula
Re#2 = 10 * r^11 * (r-1) / (r^10-1)
For worldwide spread of COVID-19, see:
https://aaamazingphoenix.wordpress.com/2020/08/09/covid-odyssey-virtual-world-tour-how-many-people-can-one-person-infect-in-your-country/
Below is a table correlating Re, r, and Re#2. New Zealand results are highlighted in the right column. Results for the simulation above correspond to r ~ 1.21 (Re ~ 2.6 and Re#2 ~ 3)

Below is a chart comparing the above values:

We see that the curves cross when r > 1.5. We note that this happens after Re > 7.5 (Re ~ 7.758).
No-one believes Re > 7 so we do not need to worry about this cross-over. Values of Re greater than 7 (r > 1.475773) can be ignored.
We look at COVIDWorld to estimate Re and hence r, or r directly, from which we can calculate Re#2.
We only need to estimate r to 2 decimal places.
For New Zealand we get r ~ 1.38 which for compatibility with our previous results we round to r = 1.4. This gives Re#2 = 5.8.
We could use 5.8 as an estimate for Ro. However we note that 1.4^2 = 1.96.
This is close to 2 so we think that r = SQRT(2) may give a better estimate for Ro.
This gives Re#2 = 6 and we adopt the estimate Ro = 6 from New Zealand Data.
We may get different estimates for Ro for various countries which we can perhaps use to obtain an overall value for Ro. Ro is not intended to be variable.
We are interested in Re#2 to estimate Ro because most experts agree that COVID-19 is infectious for two cycles (and maybe longer).
We estimated r from C[D], starting with a given day D, and C[D+d], the number of cases d days later, using the formula
r = ( C[D+d] / C[D] ) ^ (1/d)
For the 12 countries we looked at in Africa (same as in the article), we obtained the following table:

The top line shows consecutive 2-Day ratios.
The rest of the table uses the formula above the table for calculating r over a 5-day period using the cumulative number of cases in the table.
We see many days where r is 1.4 or more (see last column).
We estimate the cumulative number of cases using r=1.4

We note that the daily estimates also have the same ratio (see last column).

The Estimate is calculated using r = 1.4.
The red line provides a near upper bound for the cumulative number of cases over this range.
As for New Zealand, we assume this means for estimating Ro that r = SQRT(2).
Recall that 1.4^2 = 1.96 (close to 2).
We concluded that r = SQRT(2) provides a good value for estimating Ro.
We add to the above chart r = 1.22 and r = SQRT(2):

Below is the data table:

Note that the r = 1.22 was calculated in the article for daily new case numbers (not cumulative).
The daily case numbers (last column in the table) were converted to cumulative data with a starting value of 2 cases. See numbers to the right of the green triangles in the penultimate column in the above table.
We can now estimate Ro. We calculate Re#2 using r=SQRT(2) in the formula
Re#2 = 10 * r^11 * (r-1) / (r^10-1)
and obtain 6.05 as an estimate for Ro.
As previously for New Zealand and the rest of the world, we estimate that for the 12 African countries Ro is also at least 6.
We conclude that one person with COVID-19 may infect on average 6 other people.
We have also seen that a cumulative daily increase of r means that daily new cases also have the same rate (r). We proved this earlier.
Therefore 1.4 is also the daily rate of increase for new cases early in the outbreak.
When calculating Ro we have used r = SQRT(2).
======
Update:
======
In this post:
COVID Odyssey Ro update: Occam’s Razor~ A close shave: In NZ is Ro ~ 3, 4, or 6? What are Ro values worldwide?
we update the formula for estimating Ro to
Re#2* = 10*r^10*(r-1)/(r^10-1)
Using r = 1.4 we obtain, Re#2 ~ 4.1 (4.1432).
If we used r = 1.22 (as in the article), we would have obtained Ro ~ 2.56.
We also use 10*(1-r) as a low estimate and when r = 1.22 obtain Ro ~ 2.2 as a lower bound for Ro.
The value for Ro in the article (2.37) is close to an average of the above values (2.2 and 2.56).
Regardless we have now obtained r = 1.4 and Ro = 4.1 for these African countries overall.
======
I share my posts at:
https://guestdailyposts.wordpress.com/guest-pingbacks/

5 Comments Add yours